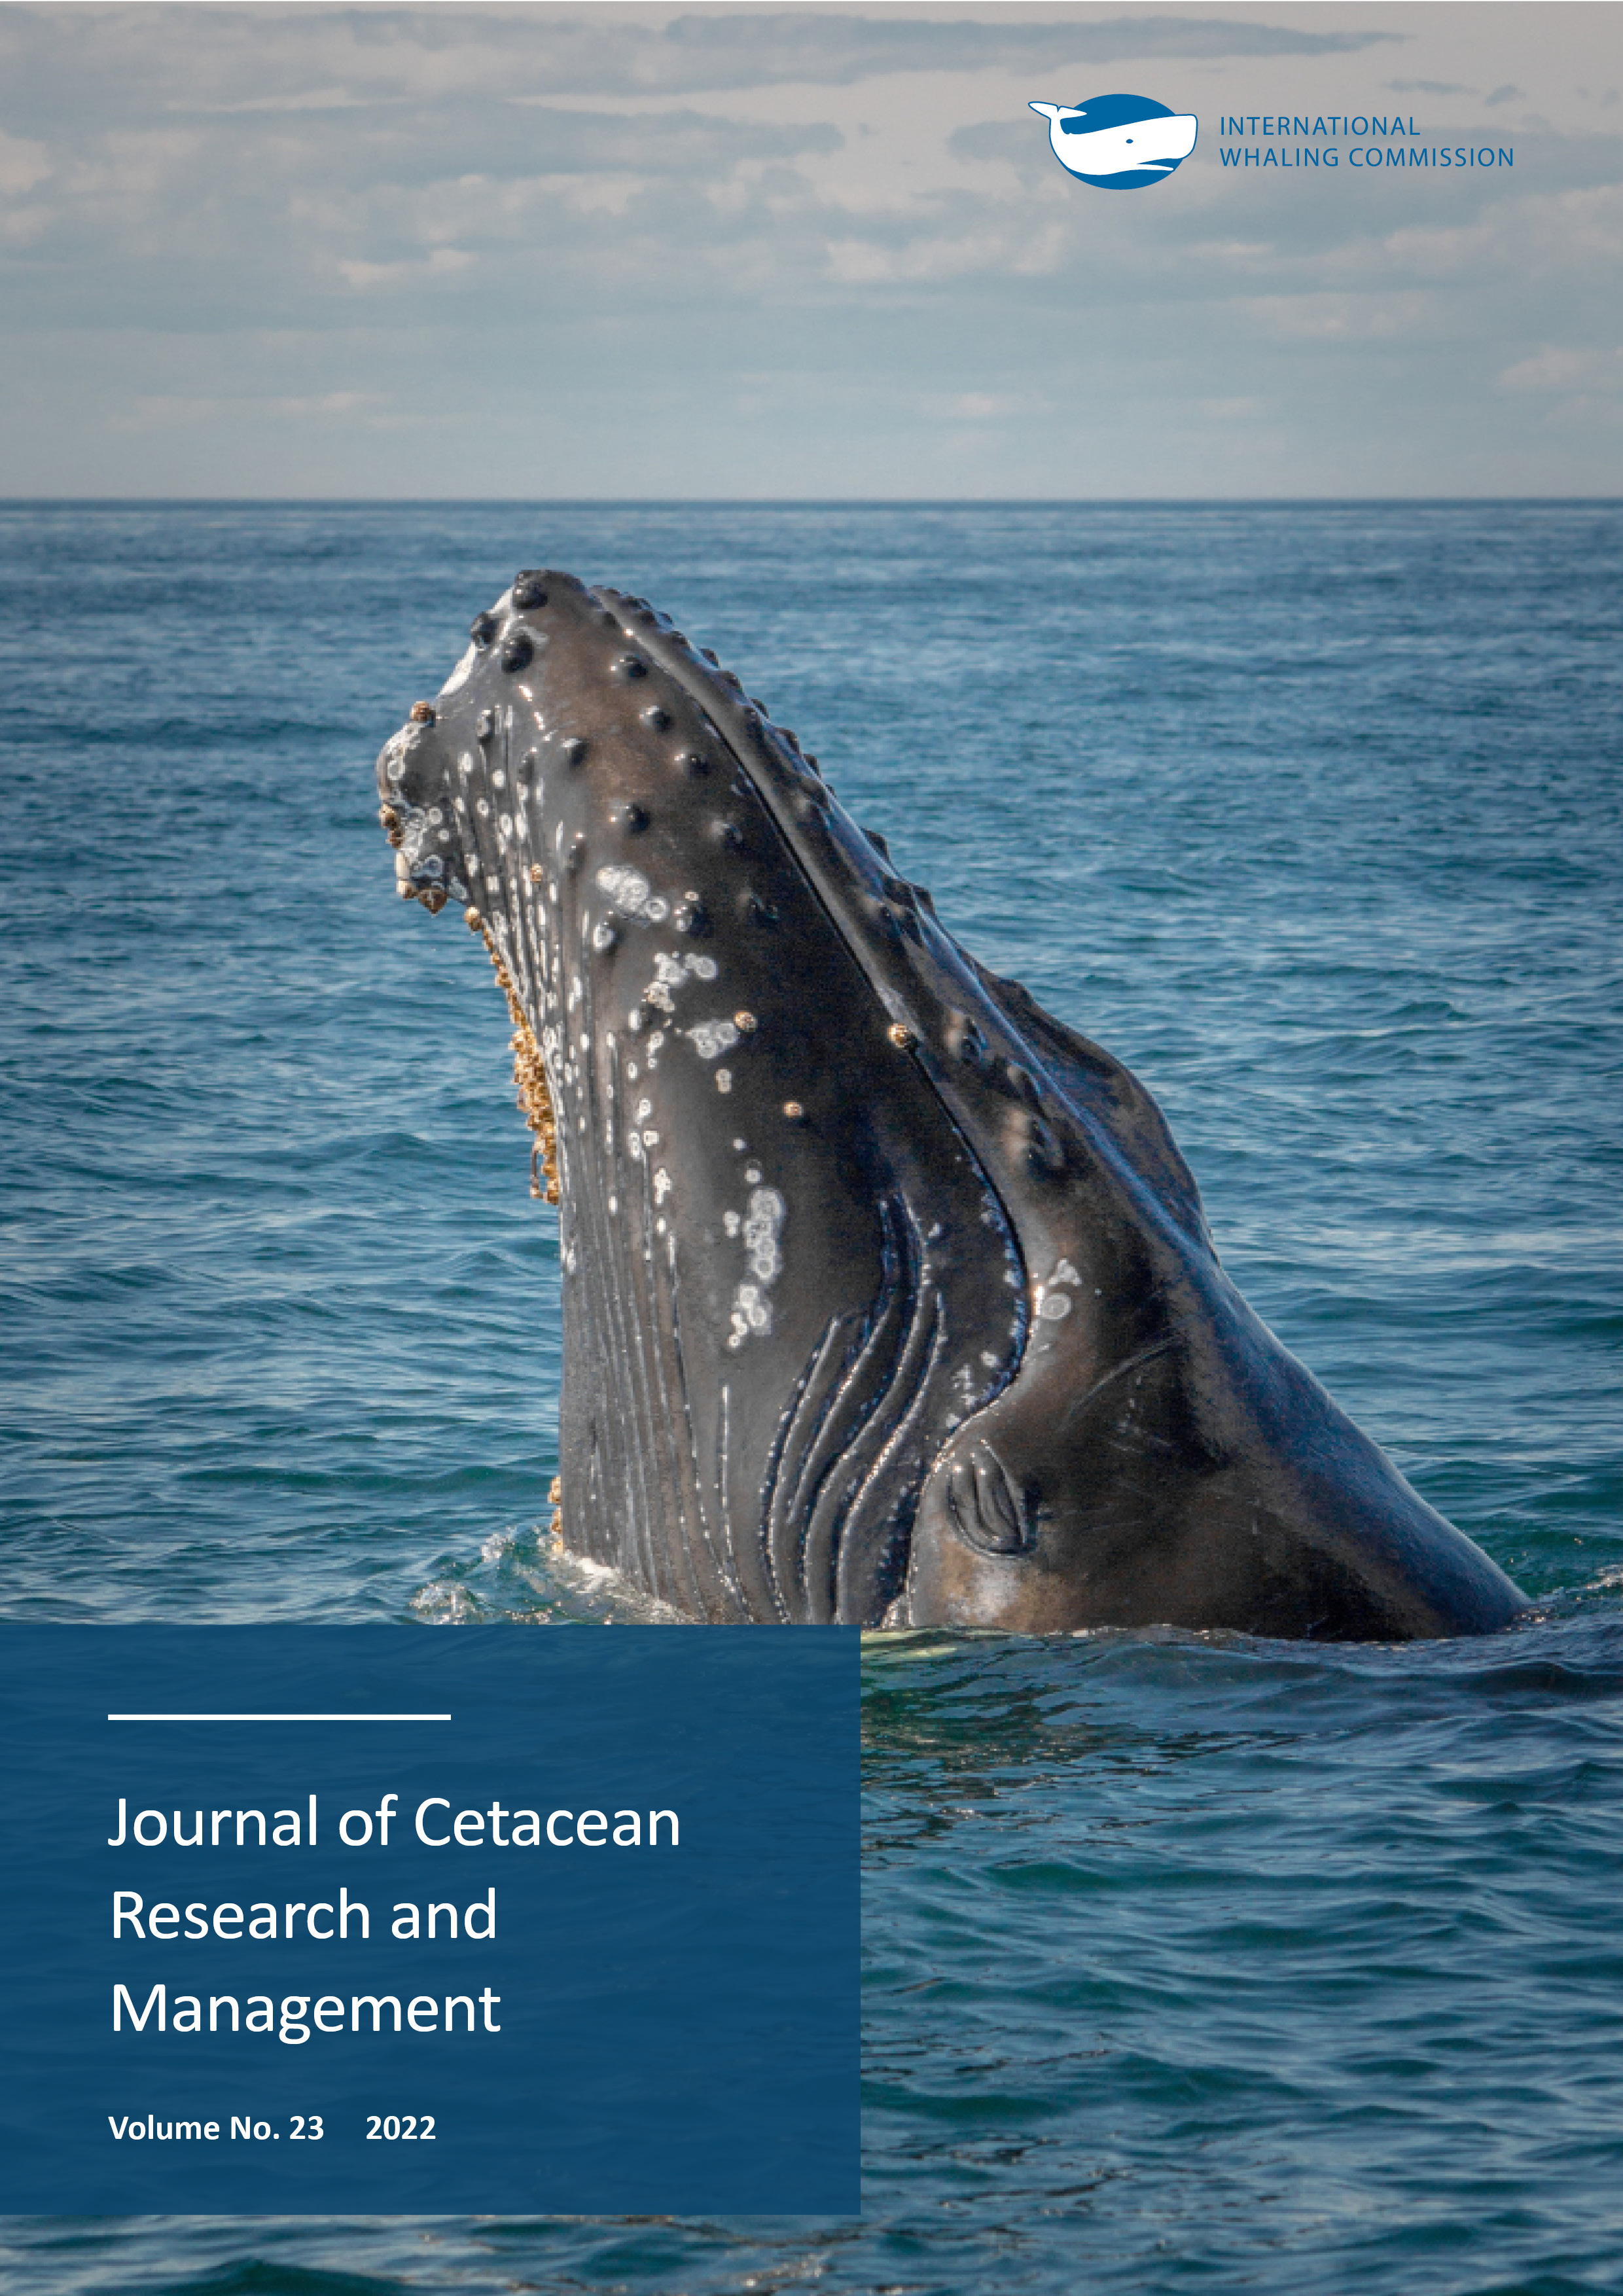
Distribution, abundance and sighting patterns of multiple stocks of bottlenose dolphins (Tursiops truncatus) in coastal Virginia waters
Contenido principal del artículo
Resumen
Three stocks of bottlenose dolphins (Tursiops truncatus) are currently known to co‐occur in the coastal waters off Virginia. A combination of visual line‐transect survey and photo‐identification (photo‐ID) methods was used to gather information on the occurrence, distribution and density of bottlenose dolphins in the coastal areas of Norfolk and Virginia Beach. Sixty‐one line‐transect surveys were completed in two zones (inshore and offshore) between August 2012 and August 2015, with on‐effort coverage of 6,550 kilometres (km) of trackline over 349.6 hours. Conventional line‐transect analysis of bottlenose dolphin sightings showed both spatial and temporal variation in density (D) and abundance (N), with highest density in the inshore zone during warm‐water months (June–November). Inshore densities were calculated as 3.51 individuals per square kilometre (km2) (N = 1,090) in the warm‐water season and 0.73 individuals/km2 (N = 225) in cool‐water months (December–May). Densities in the offshore zone were 1.24 individuals/km2 (N = 741) in the warm‐water season and 0.61 individuals/km2 (N = 366) in the cool‐water season. Warm‐water density peaks support previous research; however, this study documents a cold‐season presence of dolphins in both zones not previously reported. Twenty‐seven photo‐ID surveys were completed and a photo‐ID catalogue was created using photos taken during both dedicated photo‐ID and line‐transect surveys, containing 1,335 unique individuals. Re‐sighting numbers were low, with less than 17% of individuals documented on more than one occasion, and only 4% sighted on three or more occasions, with a maximum of 4 re‐sightings. Days between re‐sightings ranged from 5 to 970, though distance between re‐sightings spanning greater time was minimal (less than 25km). Sighting locations of photo‐IDed dolphins were broken into three regions to investigate seasonal and spatial patterns of individual distribution; dolphins sighted only in the Cape Henry (CH) or Inner Bay (IB) region were observed mostly during summer and fall seasons (93% CH, 100% IB) with none occurring during winter. For the Outer Coastline (OC) region, the majority of sightings (88%) occurred during fall and winter. Additionally, there were two individuals sighted during winter months also sighted during summer more than 130km to the north inside Chesapeake Bay (matched to a different catalogue). These sightings support the possibility that the current stock structure does not account for all dolphins in the region. Stock structure as currently understood is complicated, with overlapping spatial distribution of three stocks that separate seasonally. Our study provides information that may be useful for management, but also additional findings that could impact future stock designations
Detalles del artículo

Esta obra está bajo una licencia internacional Creative Commons Atribución-NoComercial 4.0.
You are free to:
- Share copy and redistribute the material in any medium or format
- Adapt remix, transform, and build upon the material
- The licensor cannot revoke these freedoms as long as you follow the license terms.
Under the following terms:
- Attribution You must give appropriate credit, provide a link to the license, and indicate if changes were made. You may do so in any reasonable manner, but not in any way that suggests the licensor endorses you or your use.
- NonCommercial You may not use the material for commercial purposes.
- No additional restrictions You may not apply legal terms or technological measures that legally restrict others from doing anything the license permits.

