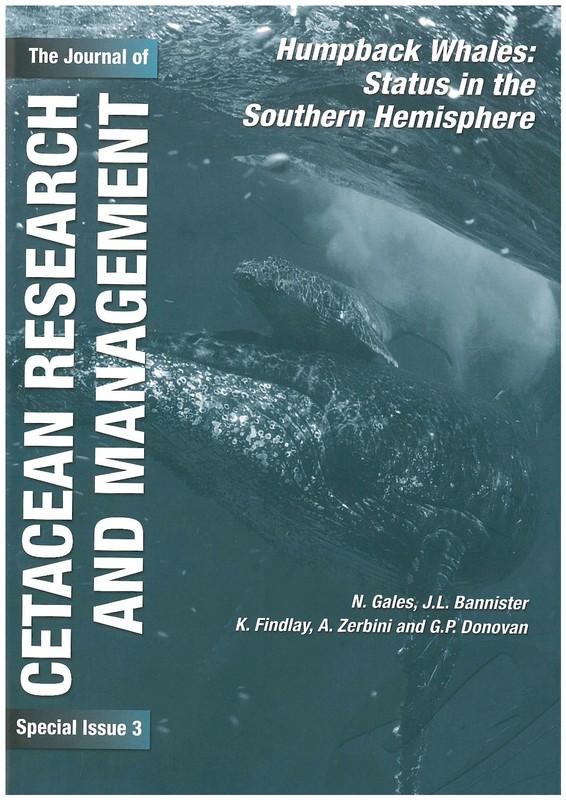
Abundance estimates and trends for humpback whales (Megaptera novaeangliae) in Antarctic Areas IV and V based on JARPA sightings data
Contenu principal de l'article
Résumé
Sighting survey data from the Japanese Whale Research Program under Special Permit in the Antarctic (JARPA) are analysed to obtain abundance
estimates for humpback whales (Megaptera novaeangliae) south of 60°S. The surveys were conducted during the 1989/90–2004/05 austral summer
seasons (mainly in January and February); the survey areas alternated between Area IV (70°E–130°E) and Area V (130°E to 170°W) each year.
Primary sighting effort totalled 293,811 n.miles over 6,188 days. Abundance estimates are obtained using standard line transect analysis methods
and the program DISTANCE. Estimated densities of humpback whales were highest east of the Kerguelen Plateau (80°E–120°E). Abundance
estimates for Area IV range from 2,747 (CV = 0.153) in 1993/94 to 31,134 (CV = 0.123) in 2001/02, while those for Area V range from 602 (CV
= 0.343) in 1990/91 to 9,342 (CV = 0.337) in 2004/05. The estimates are similar to those obtained from the International Whaling Commission’s
IDCR-SOWER surveys, which were conducted in Area IV (in 1978/79, 1988/89 and 1998/99) and in Area V (in 1980/81, 1991/92 and 2001/02–
2003/04). Estimated annual rates of increase for Area IV (16.4%; 95% CI = 9.5–23.3%) and Area V (12.1%; 95% CI = 1.7–22.6%) are also similar
to those obtained from the IDCR-SOWER surveys. The total abundance in Areas IV and V based on the most recent JARPA surveys (2003/04 and
2004/05 combined) is 37,125 (95% CI = 21,349–64,558); the confidence interval incorporates estimated additional variance. Results of several
sensitivity tests are presented that suggest that estimates of abundance and trends are not appreciably affected by factors such as different approaches
to deal with survey coverage (which in some cases was poor or included gaps). Changes in the order in which survey strata were covered and
potential effects are investigated using a nested GLM approach; a QAIC model selection criterion suggests a preference for not attempting to adjust
for such changes. Under various sensitivity approaches, the point estimates of increase rates are not greatly affected for Area IV. Although they
drop by typically a half for most approaches for Area V, they nevertheless remain within the confidence limits of the base case estimate of 12.1%
per year (95% CI = 1.7–22.6%). The presented results thus suggest that the estimated abundance of humpback whales in Area IV has increased
rapidly. Although there is also an increase indicated for Area V, it is neither as rapid nor as precisely estimated. Taking these results together with
the similar rates of increase estimated from coastal surveys off western and eastern Australia for Breeding Stocks D and E respectively, and given
demographic limitations on the increase rates possible for closed populations of humpback whales, the hypothesis is advanced that whales from
Breeding Stock E may have shifted their feeding distribution westward as their numbers have increased, perhaps to take advantage of the higher
densities of krill to be found to the west.
Details de l'article

Ce travail est disponible sous licence Creative Commons Attribution - Pas d’Utilisation Commerciale 4.0 International.
You are free to:
- Share copy and redistribute the material in any medium or format
- Adapt remix, transform, and build upon the material
- The licensor cannot revoke these freedoms as long as you follow the license terms.
Under the following terms:
- Attribution You must give appropriate credit, provide a link to the license, and indicate if changes were made. You may do so in any reasonable manner, but not in any way that suggests the licensor endorses you or your use.
- NonCommercial You may not use the material for commercial purposes.
- No additional restrictions You may not apply legal terms or technological measures that legally restrict others from doing anything the license permits.

